
Data Modelling in 2026
Kimball isn't dead, the modern stack isn't the answer, and 'AI-ready data' is a battle, not a checkbox. A working take on what to actually do.
I keep walking into teams having the wrong argument.
They're deep in it. Kimball or Data Vault. Star schema or one big table. Whether the medallion architecture is real engineering or a Databricks slide. Meanwhile the company can't agree on what an active user is, half the dbt project is models nobody queries, and the CEO still re-checks the revenue number by hand before the board call. The modelling method is rarely the real problem. Teams wear themselves out on the religion that grows up around it.
After about fifteen years building data at fintechs, most of it spent cleaning up stacks other people left behind, the take I'll defend is this: the technique wars are over, and the answer is boring. You layer. The questions actually worth arguing about in 2026 are how much to model, how well, and whether a machine can use what you built without lying about it.
The methodology wars ended in layering#
Run the "is X dead" question fast and it mostly dissolves.
Kimball is alive, just adapted. Facts, dimensions, grain, conformed dimensions, a Type 2 slowly-changing dimension: that vocabulary is the ground every BI tool stands on. What's faded is building strict multi-table star schemas all the way to the dashboard. More often the star is the foundation and you serve a wide table on top. The cargo-cult version is reflexively adding surrogate keys and snowflaked dimensions because "that's Kimball," on a warehouse where none of it earns its keep.
Inmon is dead in name only. Almost nobody builds a normalized enterprise warehouse from scratch before a single mart anymore. But the idea he was right about, an integrated layer that reconciles your sources into one version of the truth, is everywhere, just wearing new names: the medallion architecture's cleaned-up middle layer, the lakehouse integration tier, Data Vault's raw layer. Inmon himself now writes that the two camps converge on the same hub-and-spoke shape.
Data Vault is alive in a cage. For a bank with forty source systems and auditors who want to know what every number looked like on a Tuesday in 2021, hubs and links and satellites are exactly right. For a startup with five stable sources, it's a way to turn one question into a ten-table join. The rule that saves you: Data Vault is an integration layer that sits underneath. You still put a star or a wide table in front of it for anyone to actually query.
The one debate that's still live is normalization itself, and it's live because its premises moved. Kimball denormalized in the nineties because storage was expensive and row-store databases choked on joins. Both of those stopped being true. Cheap object storage made redundancy nearly free, so denormalizing (star, then wider, then one big table) became the analytical default. Then the newest columnar engines got so good at joins that ClickHouse now says openly what the field had left unspoken: "joins are no longer a constraint that automatically forces your modeling decisions," and "normalization is now a genuinely viable option." The old rule flipped, and now it's being re-examined all over again.
You can see the settlement in how the good teams actually build. Monzo published their setup in 2026: a governed mesh of more than twelve thousand dbt models across a hundred-plus teams, where cross-team "interfaces" are declared contracts, each model built around a single entity with its history. That is hand-modelling scaling up in the age of AI. Airbnb's Minerva defines every metric once and denormalizes facts and dimensions into analysis-ready tables downstream, which is a star schema feeding a semantic layer. GitLab does it all in the open, so you can read the whole setup: raw sources, then a staging layer, then Kimball-style marts, with fact tables (fct_) for the events and dimension tables (dim_) for the things those events describe. Different companies, same shape: a layer chosen for each job, one at a time.
So that's the first thing to let go of. The methodology isn't your identity. The move is to choose per layer and per constraint: how much audit do you need, how volatile are the sources, how big is the team, how expensive is the join. A star here, a wide table there, an integration layer underneath if the sources justify it.
Now: keep a dimensional core, materialize wide tables for the dashboards that hate joins, and stay strict on layer discipline. Next: the modelling starts to write itself. Tools already draft models and their metric definitions from a prompt; the human moves from typing SQL to owning what the definitions mean.


The real skill is how much, and how well#
Once you stop arguing about method, the actual craft shows up, and it has two halves.
The first is restraint: how much to model. The instinct of a good data team is to model everything into a tidy warehouse. Resist it. A persisted model is an interface, and an interface is only worth building when it's stable and shared. Build one when there's real repetition, when a definition is contested and several teams depend on it, or when a transform is expensive enough to precompute. Otherwise, let the question live in the BI tool and move on. dbt's own guidance says it plainly: "start simple and only add complexity as necessary." The deliberate act is often the decision not to persist yet.
Most over-engineering is a failure of that restraint: a fifteen-tool stack for an eighteen-person company, a medallion architecture where staging and marts would do, a data mesh with one data hire. Benn Stancil has the sharpest read on why it happens: the tooling debate is "a fun distraction from what we actually need to do: fix people and process problems." And the scale that supposedly justifies the machinery usually isn't there. Jordan Tigani's line has aged into consensus: big data is dead, "data size wasn't really the problem at all," and most companies' working set fits comfortably on one machine.
The second half is the part people are quietly nervous about. Knowing how to model well is more valuable now than it has ever been. The fear is that AI makes modelling obsolete, that you can point a model at raw tables and skip the boring part. It's backwards. Chad Sanderson put the pre-AI version of this well: without modelling, "a data warehouse quickly becomes a data swamp." AI raises the stakes on that, because now a machine is reading your swamp and reporting numbers from it with total confidence. The dbt community's own survey lands in the same honest place: teams are using AI everywhere, they're investing to accelerate their data people, and the single most common problem they report is still poor data quality. The craft is carrying more of the weight now.
Who does it? For most companies the answer is a small central team of analytics engineers, the people who sit between the engineers moving data and the analysts using it. Data mesh, pushing modelling out to every domain team, is a real answer at true enterprise scale and an expensive pretense below it. If you have one data hire, a mesh is just that person with a grander title.


Now: right-size everything, start simple, and treat modelling as a craft you staff for, not a chore you automate away. Next: models get drafted by agents and reviewed by humans, but someone still has to own what "revenue" means, and that someone is you.
"AI-ready" is a battle, not a checkbox#
Half the internet sells "AI-ready data" as a state you reach: clean your models, buy a semantic layer, and the agents just work. That's not what happens.
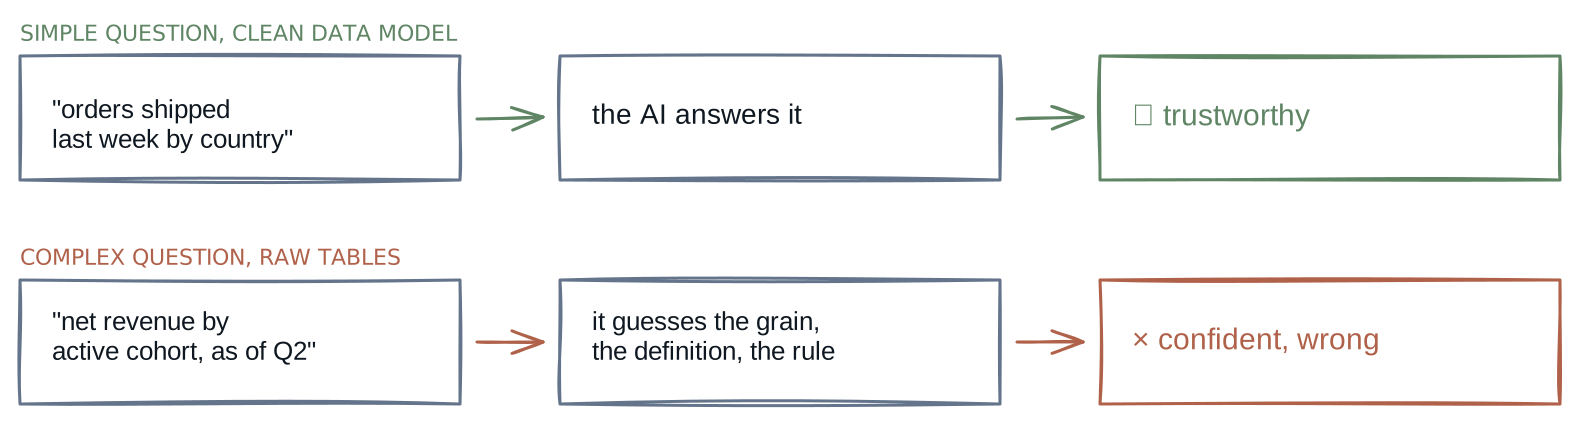
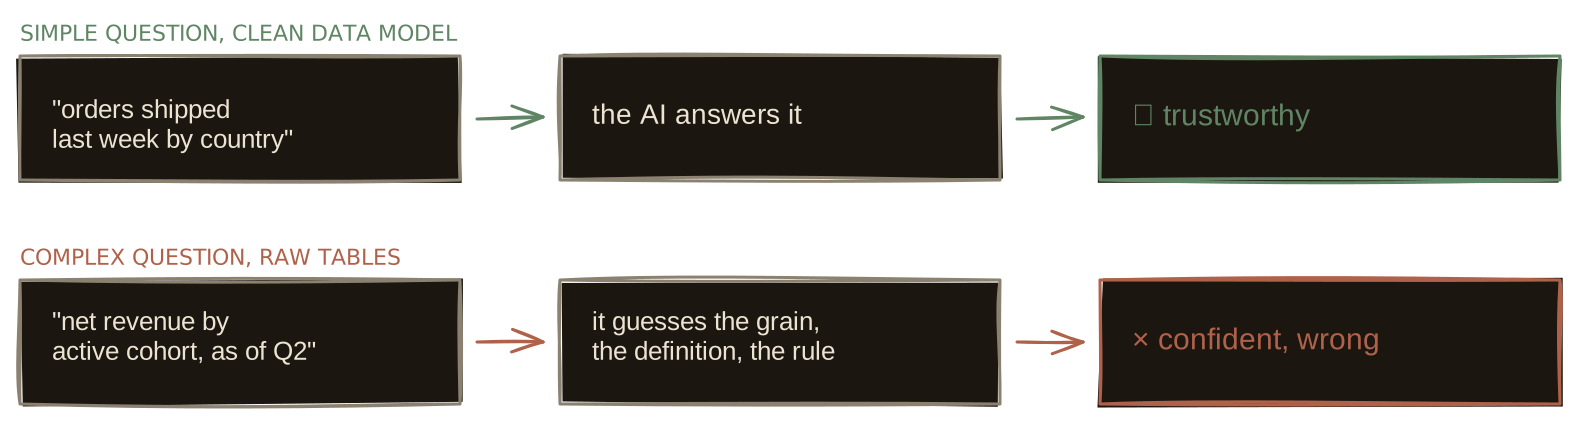
Start with the good news, because it's real. On clean, well-named data, modern AI models are strong at simple questions. Point a good one at a tidy schema and ask "how many orders shipped last week by country" and it will nail it, over and over. Well-modelled data does eliminate a whole class of hallucination: the failures that came from cryptic column names and dirty values. That's not nothing. That's most of your everyday BI.
Then the question gets one notch harder, and the scores collapse. This is the part the demos never show you. There's a benchmark, Spider 2.0, that tests AI models on real enterprise databases, the kind with a thousand columns and business logic nobody wrote down. The same models that clear ninety percent on tidy textbook databases solve about a fifth of the tasks on real enterprise ones, and the weaker ones far less. One frontier model went from 87% on the easy benchmark to 10% on the hard one, which tells you the hard version is a different task entirely.
And the reasons are painfully familiar to anyone who's actually built analytics, because they're the same things that trip up a new analyst:
- Grain. The AI joins two tables on the wrong key, silently doubles the rows, and hands you revenue that's twice what it should be. It looks fine. It's wrong.
- Definitions. "Active user" excludes internal employees, at your company. The AI has no way to know that. It picks a plausible column and answers with confidence.
- The rules that live in Slack. The real business logic, the fiscal calendar, the exclusions, the "we don't count that region," lives in old threads and product specs, not in the schema. The AI can't read what you never wrote down.
A clean schema doesn't fix any of these, because none of them are in the schema. That's the whole point. Good modelling is necessary and nowhere near sufficient.
The practical response is not a magic box. You wrap the AI in the same boring rigor you'd give a junior analyst you don't fully trust yet. In practical terms, for analytics people rather than AI researchers:
- Put governed metrics in front of it for the numbers that matter. A semantic layer means the AI asks for "revenue" and gets your revenue, computed your way, instead of writing its own SQL and guessing. The failures turn into "I can't answer that" instead of a wrong number, which is exactly the trade you want. That layer can live in your marts long before it's a tool you buy.
- Keep the questions inside what you've modelled. The AI is reliable on the paths you've paved and dangerous off them. Scope it to what's governed, and let it fail loudly when someone asks something you haven't modelled, rather than making one up.
- Make it check its own work. Run the query, then reconcile the total against a number you already trust. The good AI analytics systems all do a version of this, run-and-verify. You should too.
- Let it say "I don't know." This is the one most teams skip, and it's the most important. A model that abstains on the questions it can't answer is worth far more than one that answers everything and is wrong a third of the time. Reward the shrug.
- Keep a human on the hard ones. The grain traps, the point-in-time joins, the definitions that live in someone's head: those still need a person who knows the model. That person is the analytics engineer you were told AI would replace.
None of this is exotic. It's the semantic layer you were half-building anyway, plus the discipline of not trusting a confident machine any more than you'd trust a confident stranger. A shipped system at LinkedIn, with a knowledge graph doing the grounding, runs at about half its answers correct-or-close in production. Half. That's the honest state of the art on hard enterprise questions, and it's why "AI-ready" is a direction you keep moving in, with a real ceiling, not a finish line.
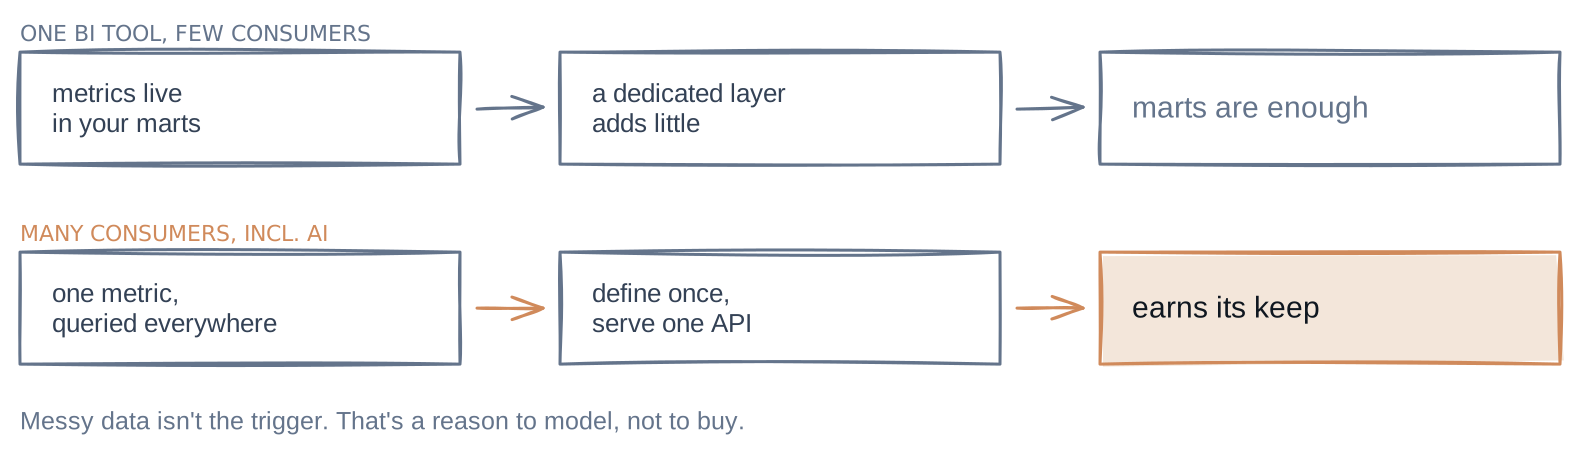
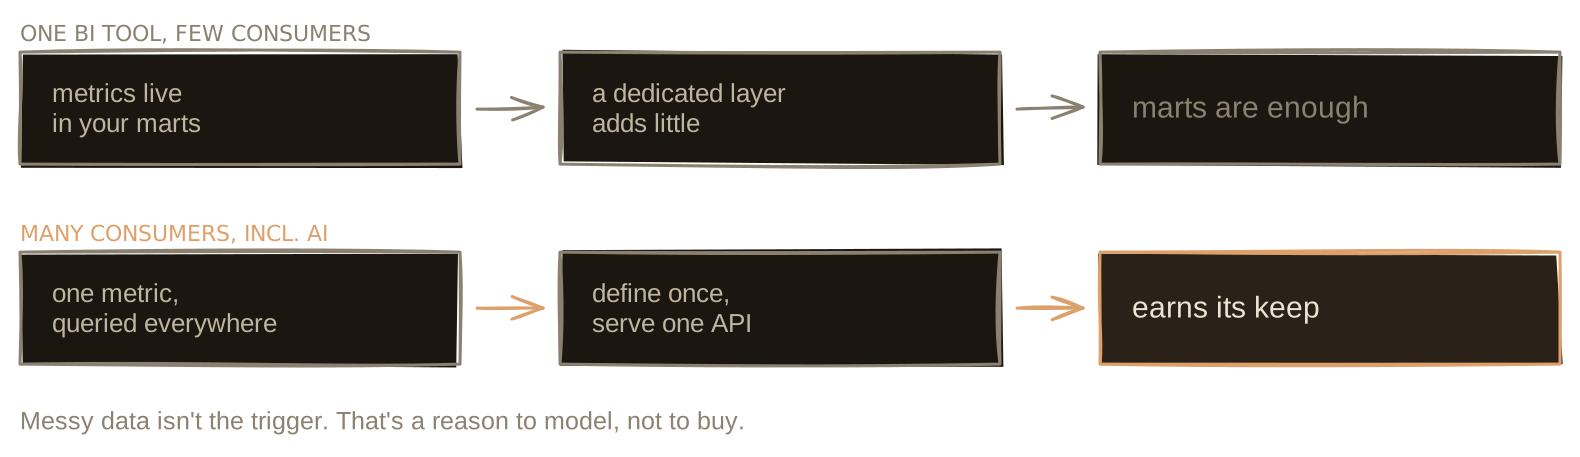
There's a harder ceiling above that one. Getting the number right is accuracy. Knowing which number to ask about is usefulness, and that second thing is where the semantic layer runs out of road. When revenue drops, the real question isn't "what was revenue," it's "which input moved, and which lever do I pull." The semantic layer can't help with that. It defines each metric on its own island, so it knows what revenue is without knowing that revenue is traffic times conversion times average order value, or that onboarding completion is the thing that actually moves retention.
That missing knowledge has a name: a metric tree, the map of how your metrics drive each other. Levers Labs calls it "the logical representation of a business's growth model." Some of its edges are pure arithmetic, the funnel math where the relationship is exact. Others are empirical, the "engagement seems to lift retention" links you only learn by running the experiment, and the honest move is labelling which is which. The semantic layer defines the nodes. The tree defines the edges.
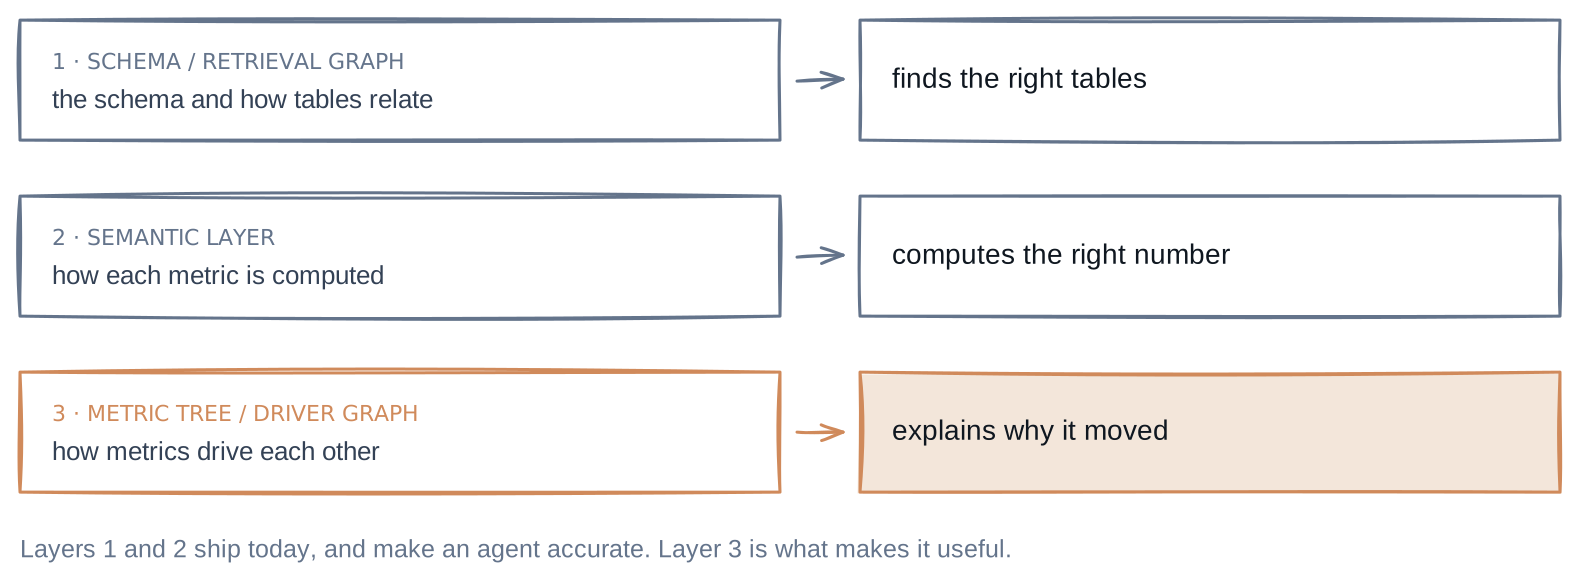
It's also where the tooling is moving. Mixpanel bought DoubleLoop in 2025 to put metric trees inside the analytics product, and Trace builds the tree as a computable graph that sits on top of your warehouse, "dbt-aware," in their words, rather than a replacement for it. For an analytics agent, this is what separates a fast SQL writer from something that can debug a business: hand it the driver graph and it can walk from the symptom down to the cause and back up to the lever. An agent doing that reasoning unsupervised is still mostly a 2026 promise, not a shipped feature. The direction, though, is hard to miss. The parts you can buy or generate are the tables and the definitions. The metric tree, the map of how the business actually grows, is the part that stays yours.
Now: define your metrics once in front of the numbers that matter, scope the agent to what's modelled, make it self-check, and let it abstain. Next: the AI queries your governed layer instead of writing raw SQL at all, and the metric tree behind it becomes the interface between the business and the machine, which is to say more central than ever.
A note on tools, kept short#
The tool churn is real and mostly noise. dbt is still the center of gravity, now faster and merged into Fivetran; SQLMesh is the sharper challenger that pushed the whole field forward; Iceberg won the table-format argument, so the warehouse is becoming a swappable engine over shared files; and DuckDB is the reminder that a lot of you could run your whole analytics stack on a laptop. Pick the smallest set that covers your actual problem, and remember the modelling is doing the real work either way.
The point was never the model#
A data model earns its keep from one thing: the decisions it holds up, and now, the machines it lets act without lying. Being modern or clever has nothing to do with it.
So model deliberately, and layer honestly, one choice per constraint. Build for how much and how well. When the next AI demo dazzles the room, remember that a confident answer and a correct one come apart on exactly the questions that matter, and closing that gap is the whole job of a data model. That's the spine. Everything else is fashion.
Sources & further reading
- When to Denormalize, When to Join — ClickHouse
- A Tale of Two Architectures: Kimball and Inmon — Bill Inmon
- Star Schema vs. OBT for Data Warehouse Performance — Fivetran
- A meshy approach to data — Monzo
- How Airbnb Achieved Metric Consistency at Scale (Minerva) — Robert Chang, Airbnb
- How we structure our dbt projects — dbt Labs
- Spider 2.0: Evaluating Language Models on Real-World Enterprise Text-to-SQL Workflows — Lei et al. (ICLR 2025)
- The context layer — Benn Stancil
- Big Data is Dead — Jordan Tigani, MotherDuck
- Introducing Metric Trees — Trevor Fox & Abhi Sivasailam, Levers Labs
- How Trace works — Trace
- Mixpanel acquires DoubleLoop — Mixpanel
Read next
- Data Platform9 min
What I Look For in a Data Platform Audit
The fastest way to tell if a data platform is any good has nothing to do with the stack. It's whether two teams can agree on a single number.
Read - Metric Systems12 min
How to Build a Metric Tree Leadership Actually Uses
A metric tree is not a list of KPIs. It is a model of how your business creates outcomes, and a map for where to look when a number moves.
Read - Decision Systems9 min
Why Dashboards Don't Fix Decision-Making
A dashboard is the easy part. The layer that turns a number into a decision is the part nobody is assigned to build, which is why it's usually missing.
Read
Want to see where your AI analytics can silently fail?
The AI Analytics Reliability Audit benchmarks your AI analyst against real business questions and leaves you with a prioritized repair plan.