
Data Culture Is Really Decision Culture
Most companies chasing a “data culture” are chasing the wrong thing. What they actually want is a decision culture, and you can build one like a product, not a poster.
Walk into most companies that call themselves "data-driven" and you find the same thing: dashboards everywhere, and a leadership team that still argues its way through every meeting.
The charts are there. The pipelines run. And the important decisions still get made the way they always were, by whoever is most senior or shouts loudest.
The instinct is to blame the data: build a better dashboard, buy a better tool, hire another analyst. Sometimes that helps. Usually it just adds one more surface nobody acts on.
So I've stopped saying "data culture" with clients. Fifteen years of building this inside fintechs and scaling teams has convinced me the phrase points at the wrong target. What a company actually wants is a decision culture, and the moment you name it that way, what to build gets clearer.
Companies are decision factories#
The sharpest version of this I've heard comes from Abhi Sivasailam of Levers Labs: when we talk about "data culture," we're really talking about "decision culture." Once it clicks, it's hard to unsee.
The mental model I keep coming back to is a factory. The raw material is messy, scattered information about customers, product, money, and risk. The finished good is an operating decision: where to spend, what to build, what to stop. Over a long enough horizon, a company lives or dies on three properties of that conversion: the quality of its decisions, the speed with which it makes them, and the ease with which it can react and try again.


Two things are missing from that list. "How many dashboards do we have?" is one. "Is our stack modern?" is the other. Those are inputs at best, vanity at worst. The scoreboard is the decisions, and a decision culture is just the set of conditions that lets a company make good ones over and over without heroics.
What a decision culture actually requires#
Strip it down and four conditions do most of the work:
- Shared context: everyone reads the same reality. Same numbers, same definitions.
- Predictability and auditability: you can look back and see why past decisions went the way they did, and look forward and forecast the next ones.
- Diffuse inputs: the ability to propose and decide is spread through the organisation, not hoarded at the top.
- Right is right: it's only marginally harder to make a decision that's high-stakes or unpopular. Facts beat politics often enough that people bother to bring them.
The one everyone underestimates is the last. Shared context and clean definitions are table stakes. What actually decides whether a company has a decision culture is whether being right survives being inconvenient. If the highest-paid person's opinion still wins the moment the data disagrees, none of the other three matter, and people learn fast that the numbers are decoration.
The best version of all four I've seen up close looked nothing like a "data initiative." It started with one unglamorous habit: the CEO running the weekly leadership meeting off the model. Not glancing at a slide, but reading the numbers, asking why they moved, deciding in the room. From there it cascaded. Each region and business unit owned its own key metrics and lived inside that operating model every day. Data-quality problems stopped being a quarterly cleanup and became a weekly routine, and because people depended on those numbers to run their part of the business, quality compounded upward instead of rotting.
It rarely lands on the first attempt. The version that fails treats the review as a report to be shown, a deck the data team presents while everyone nods and then goes back to their gut. The version that works treats it as a meeting the business runs on the numbers, with the data team in the room but the decisions belonging to the operators. The difference is who owns the number. That is the whole game: shared context because everyone reads the same model, diffuse inputs because every unit owns its slice and can act on it. No tool sells you that. It gets built week by week, into how the company operates.
Build it like a product, not a project#
The tell is the word "project." Projects have an end date. A decision culture doesn't, so treat it as a product you keep shipping rather than a reporting service with a ticket queue. Three moves, borrowed from how a good PM works.
Start with outcomes. Not "what dashboard do you want," but "what decision are you trying to make, and how will you know it went well?" The dashboard is the last thing you design, not the first.
Design for jobs. Every role hires data to do a job. A regional lead doesn't want a chart; they want to catch a problem before it shows up in the monthly review. Write the job down as a sentence and the requirement gets obvious.
Launch and grow. A new report is a product launch: people have to adopt it, get value from it, and keep coming back. Ship it and walk away and it dies, the same as any unmarketed product. That last step is where most "data-driven" pushes quietly fall apart, so it gets its own section.
The leverage is unglamorous#
Every data team I've run wanted to spend its time at the glamorous end: forecasts, models, "insights." I get it; that's the fun part. But Sivasailam's catalogue of eight "data jobs" makes an uncomfortable point clear. The leverage sits two steps earlier, in the least glamorous work there is.


If your model of the business is clear and your monitoring of it is trustworthy, every later job gets cheap. Root-causing a drop, forecasting next quarter, running a review: all of it is easy when there's a shared, reliable map underneath. Skip that step and you're forecasting on sand.
That map is the metric tree: the outcome metric on top, decomposed down through its drivers to the inputs a team can actually move. It's the single highest-leverage artifact in the whole decision culture, and the thing most companies never sit down and build.
Why "data-driven" initiatives stall#
You can build the perfect metric tree, wire up trustworthy monitoring, and still watch the whole thing get ignored. Getting people to actually use it is a behavioral change problem, and behavior has its own physics.
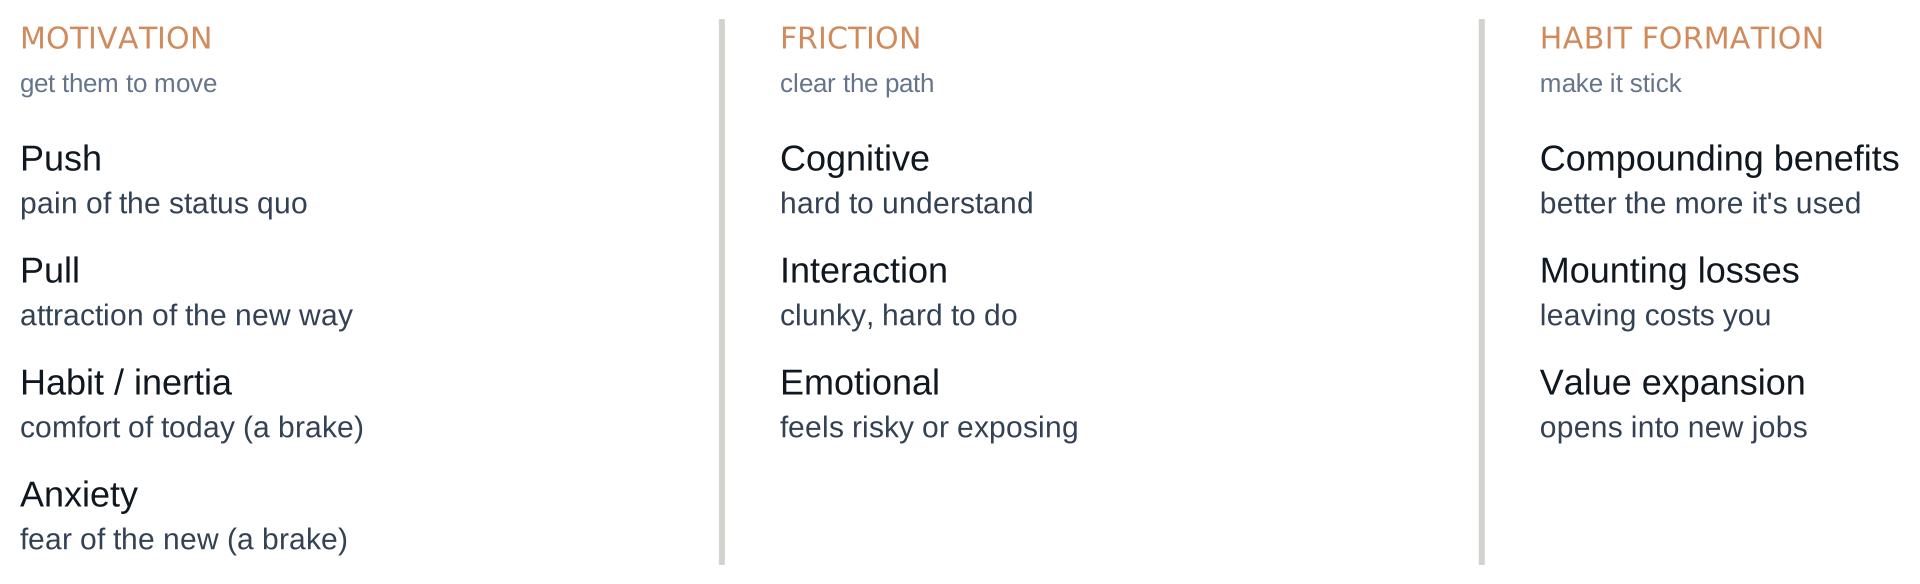
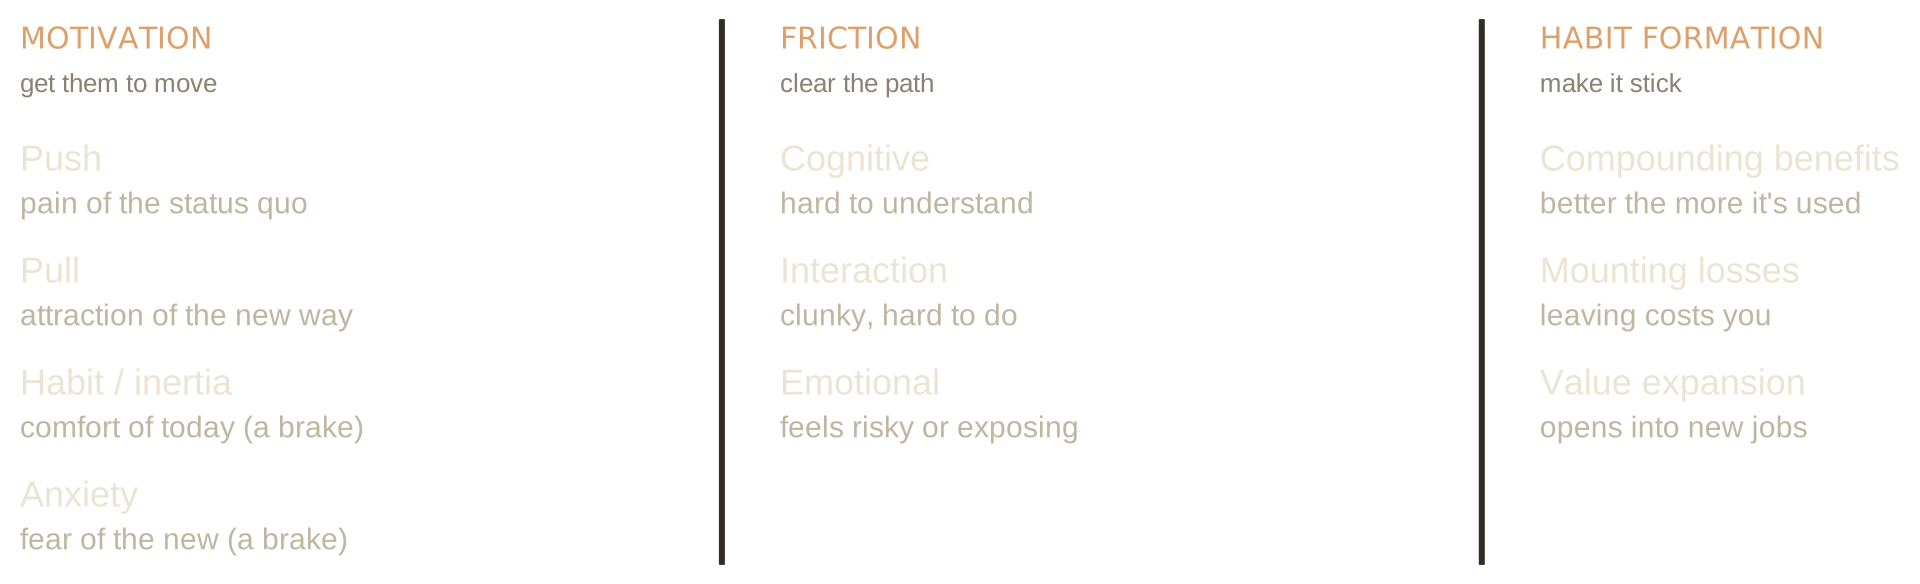
Run a stalled rollout through that model and the diagnosis is usually quick. Most of the time the motivation was too weak, with no real pain in the old way and no real pull toward the new. Or the friction was too high, and acting on the number was harder than opening a spreadsheet. Or there was no habit loop at all, so people tried it once and drifted back. Most "enablement," a half-day workshop and a Slack announcement, is nowhere near the energy needed to move an organisation off its defaults.
Underneath all of it sits a prerequisite: shared definitions. The fastest way to kill trust is to let a core metric mean three different things in three different rooms. The fight I remember most wasn't about revenue. It was about activation. What counts as active (opened the app? took a meaningful action? funded the account?) and over what window quietly decides whether the growth story looks healthy or broken. Every camp had a definition, and every definition was "right." Two teams computing it two ways don't have a data disagreement; they have two realities and no shared context to decide from. It doesn't resolve itself. You pick one, give it an owner, write it down, and defend it.
That alignment work, across business units, product, the data team, and leadership, is unglamorous and completely non-optional. It's also what finally makes a number safe to act on.
What actually makes it stick#
Here's what I've watched actually work, and what I now design for from day one:
- Leadership operates on the model, visibly. If the CEO runs the meeting off the numbers, everyone else follows. If they don't, no tool will save you.
- Every unit owns its own metrics. Ownership is what turns a dashboard from a thing you're shown into a thing you're responsible for.
- Definitions are aligned once, and defended. One owner per metric, agreed across product, data, and leadership, before the arguments start.
- Data quality is a weekly routine, not a cleanup project. Depend on the numbers often enough and quality compounds upward instead of decaying.
- The metric tree comes first. It aligns the room and aims the engineering, before you've instrumented a thing.
None of this is a technology decision. Amazon has a line for why: good intentions don't work; mechanisms do. A decision culture isn't a value you post on a wall. It's a set of mechanisms (a shared model, owned metrics, aligned definitions, and a leadership cadence that runs on them) that make the good decision the path of least resistance.
The backbone#
"Data culture" makes it sound like a mood. It's really an operating system for how a company decides: designed, built, and maintained, or not there at all.
That's the whole thesis behind Decision Spine, and why the name isn't "Data Spine." The point of the data was never the data. It was always the decisions the data is supposed to hold up: the analytical backbone a company leans on when it needs to decide quickly and be right.
Build the decision culture, and the dashboards finally start earning their keep.
Sources & further reading
- Data Culture as a Product (Data Council) — Abhi Sivasailam, Levers Labs
- How Data-Driven Companies Plan (MDS Fest) — Abhi Sivasailam
- Introducing Metric Trees — Levers Labs
- The Amazon Weekly Business Review — Commoncog
Read next
- Data Platform16 min
Data Modelling in 2026
Kimball isn't dead, the modern stack isn't the answer, and 'AI-ready data' is a battle, not a checkbox. A working take on what to actually do.
Read - Data Platform9 min
What I Look For in a Data Platform Audit
The fastest way to tell if a data platform is any good has nothing to do with the stack. It's whether two teams can agree on a single number.
Read - Metric Systems12 min
How to Build a Metric Tree Leadership Actually Uses
A metric tree is not a list of KPIs. It is a model of how your business creates outcomes, and a map for where to look when a number moves.
Read
Want to see where your AI analytics can silently fail?
The AI Analytics Reliability Audit benchmarks your AI analyst against real business questions and leaves you with a prioritized repair plan.